Recognition
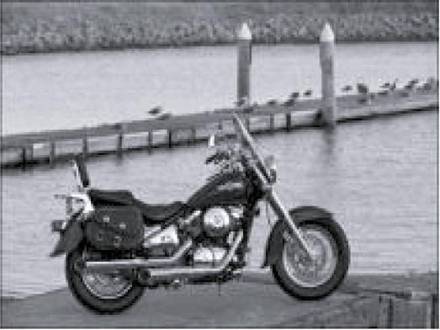
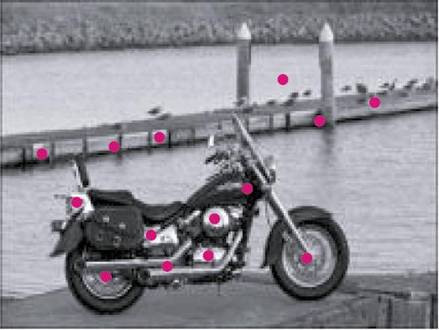
Recognition proceeds in the same manner as learning, in that we take a query image (below on left) and then find the salient regions, whose centres are indicated with magenta dots on the figure on the right.
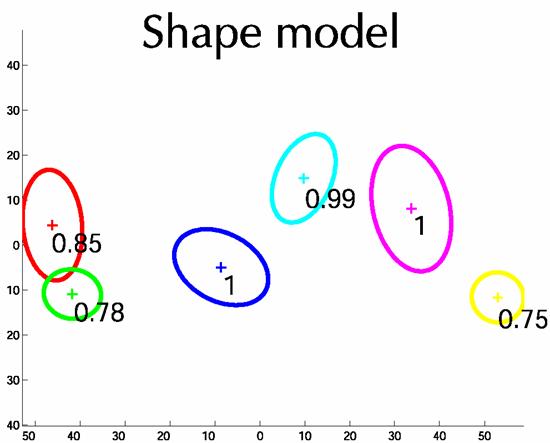
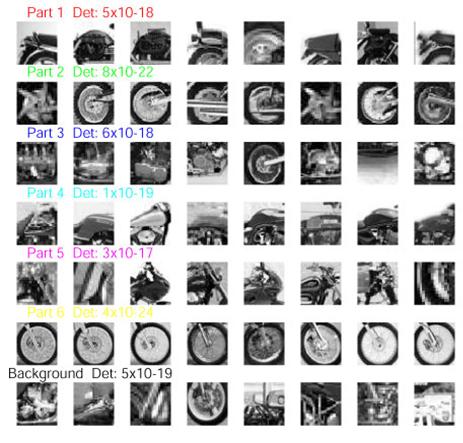
We then take the model training on lots of motorbike images, like the one below. On the left we show the shape model. Each part of the model is shown in a different colour. The mean location is indicated by the cross, with the ellipse showing the uncertainty in location. The number by each part is the probability of that part being present. On the right, we show examples of regions which are closest to the mean of the appearance density of each part. We can see that the wheels of the motorbike are cleanly picked up, along with the rear of the bike and the fuel tank and the handlebars/front fork region.
With this model, we then find the assignment of regions that fits the model best. This is indicated in the picture below:
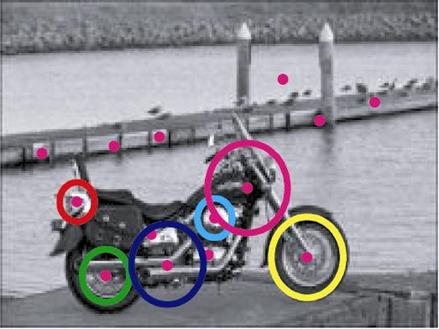
If the score of this assignment is above a threshold, we declare that we have found a motorbike at this location. If it is below the threshold, we declare that there is no instance of a motorbike in the image.
So now let's look at some proper experiments.