Graph of Life
Dennis Shasha
Courant Institute of Mathematical Science
New York University
shasha@cs.nyu.edu
Chien-I Liao
Courant Institute of Mathematical Science
New York University
cil217@nyu.edu
Contents:
Motivation
Phylogeny is a tool biologists use to represent the evolutionary relationship
between different species. Historically, most believe that this evolutionary
relationship could be represented using trees. With the advent of genomics,
numerous computer algorithms have been used to build phylogenetic trees.
However, discrepancies observed in phylogenetic trees lead some (including
us) to believe that evolution does not actually occur in a tree-like fashion.
Moreover, events such as hybridization or horizontal gene transfer occur in
nature and may play an important role in evolution. Trees are incapable of
representing such events. Therefore, to represent evolution accurately, we
need to use a network representation.
In this research we introduce the Graph of Life to model the history
of evolution by allowing interbreeding events (also known as species
recombinations). The idea is to examine the DNA sequences in each species,
generate the top few most possible phylogenetic trees for each gene family,
then pick one from each gene and combine them into a directed acyclic graph.
In the final graph, some species may have multiple parents which indicate
ancient interbreeding events. The interbreedings, however, should be rare
compared to gene mutation. Therefore our goal is to pick trees as similar as
possible and combine them with a minimum number of interbreeding events.
* Some previous work can be find
here.
top
Download Software/Submit Data
The software is not yet published but you may submit your data using
the following form. Both input format and parameter explanation could be
found in the next section. For questions about the format,
to send any feedback to our software or to download the source code, please
contact Prof. Dennis Shasha or
Chien-I Liao
top
Documentation
Introduction:
If you are not familiar with phylogenetics, here is a
brief introduction to our problem.
Input:
- The input should be a file of gene trees, the phylogenetic trees
suggested by genes.
- The gene trees should be given in the form of well-parenthesized
strings, with species names as leaf labels (the
Newick tree format). The default delimiter is whitespaces but could
also be set to other characters such as commas (see
parameter -w/--delimiter for details).
- The name of the gene and the tree score/rank could be optionally tagged
after each tree. If no tag is present, the software will automatically
assign a name to it and assume there is only one tree associated with
that assigned name.
- The tree score/rank is an indicator for tree support. The lower the
score/rank is, the stronger the support the tree has. Therefore our
software tends to select trees with smaller score/rank. But this meaning
can also be reversed (see parameter
-r/--reverse_score for details). If that parameter is presents,
trees with higher scores will be preferred.
A sample gene tree:
(Calb ((Scas ((Spar Scer Sbay) Smik) Skud) Sklu))
[geneA:457]
Sample input file
Note: we allow missing orthologs in species, i.e., the gene trees need not all
share the complete set of species.
Parameters:
Parameters are passing by UNIX-like command line flags in this software. It
supports two forms: "-x arg" or "--argname=arg". Please refer to the
full description of parameters.
Sample commands:
python graph_of_life.py
python graph_of_life.py -f data1 -d 0
python graph_of_life.py --filename=data2 --debug=2
Output:
The output graph will be written in
the dot
language. dot is a free graph drawing program originally
developed under UNIX platform. For Unix users, run the following commands:
python graph_of_life.py -d 0 [other optional flags] > filename.dot
dot -Tps filename.dot -o filename.ps
(for .ps output)
dot -Tjpg filename.jpg -o filename.jpg
(for .jpg output)
Note the "-d 0" is necessary for a clean dot output. The default debug level
is 1 thus the default output contains extra messages and can't be parsed by
the dot program.
For other operating systems, please visit
www.graphviz.org to download dot.
Here is very good
documentation for
the dot language.
top
Algorithms
The phylogenetic tree is built based on a wide variety of
information, including genetic analysis, biochemical analysis and analysis
of morphology. It it quite possible that different trees are suggested
by different sources. And our goal is to preserve all information
available. Therefore instead of choosing one consensus tree and dropping
all the others, we combine all trees into a single graph.
We start by introducing some simple notation. The ortholog of gene g
is the variant in each species having gene g. That means each
species appeared in trees suggested by g has an ortholog of
g. Since orthologs in different species are all slightly
different, we use subscript strings to identify them. Therefore for this
gene tree:
(Calb ((Scas ((Spar Scer Sbay) Smik) Skud) Sklu)) [geneA:457]
The corresponding orthologs in each species:
Calb: {geneA_1}
Scas: {geneA_211}
Spar: {geneA_21211}
Scer: {geneA_21212}
Sbay: {geneA_21213}
Smik: {geneA_2122}
Skud: {geneA_213}
Sklu: {geneA_22}
Generally, a species contains ortholog X_ijk if gene X suggests a tree
where this species is the kth child of the jth
child of the ith child of the root.
Assumptions:
We modeled the history of evolution using only gene mutation and
interbreeding events. Therefore there are 3 assumptions in this study:
- A variant is likely to arise only once in the tree or network
(Convergent evolution events are not allowed.).
- If species X has only one parent P, then for each gene A, the variant of
A in X must be the direct descendent of the variant in P or equal to
that variant (e.g., A_12 --> A_121 or A_12 --> A_12).
- If species X has more than one parent, then for each gene A, the variant
of A must descend/be equal to the variant in exactly one parent.
Our goal is to output a graph with a minimum number of interbreeding events.
If there is a tie, choose the one which minimizes the total tree score/rank.
However, it has been shown that even merging two trees into a graph with the
fewest interbreeding events is NP-hard[3]. Therefore
some good heuristics are needed to solve it.
We have divided our problem into two stages:
- Tree selecting:
select one tree from each gene
- Tree combining:
combine the selected trees into a graph
We have developed two algorithms: Consensus Method and
Simulated Annealing
for the tree selecting problem, and we have associated the tree
combining stage with a hitting set problem. Details are
described in the algorithm page.
top
Results
All input data was adapted from Rokas et al [1]. Each
tree has the same 8 sequenced yeast species.
- One tree per gene:
In this case, only tree combining was performed. The input consists of 9
different gene trees given in [1]. The recombined
graph has 5 interbreeding events and 3 hybrid species:
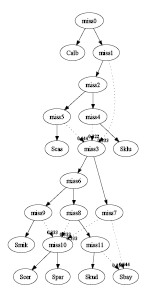
graph1.pdf
- Multiple trees per gene:
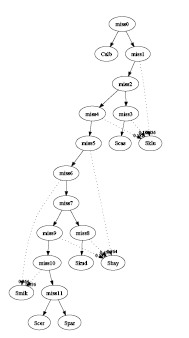
- Consensus Method:
The input consists of 496 genes. The
PAUP* software was used to
generate the top 10 most parsimonious trees for each gene. In 4960
generated trees, only 511 of them were distinct. We further discarded
trees that appeared less than 10 times (suggested by less than 10
genes) such that only 76 different trees were left. At the end 11
trees were selected by this method and the combined graph contained 5
interbreeding events and 3 hybrid species (See
algorithms for details) :
graph3.pdf
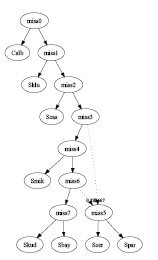
- Simulated Annealing:
The input consists 3 of genes. Each has 3 possible trees. All 9 trees
are different. One tree was selected from each gene and the combined
graph has 1 interbreeding event with 1 hybrid species:
graph2.pdf
top
References
- A. Rokas, B. L. Williams, N. King, and S. B. Carroll.
Genome-scale approaches to resolving incongruence in molecular
phylogenies. Nature, 425:798-804, 2003.
- D. L. Swofford. PAUP*: Phylogenetic
analysis using parsimony (and other methods), 1996. Sinauer
Associates, Underland, Massachusetts, Version 4.0.
- L. Wang, K. Zhang, and L. Zhang. Perfect
phylogenetic networks with recombination. Journal of Computational
Biology, 8(1):69-78, 2001.
top
Chien-I Liao